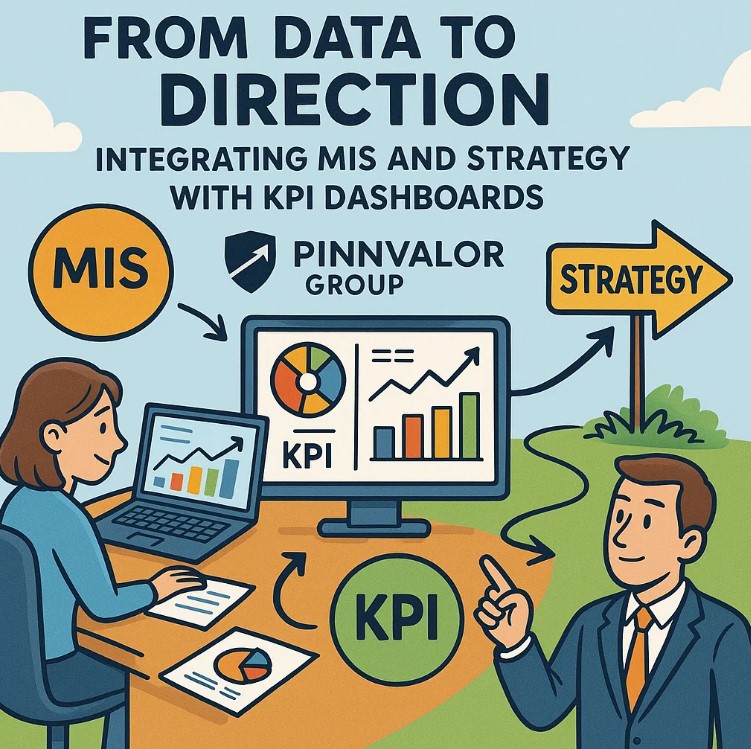
From Data to Direction: Integrating MIS and Strategy with KPI Dashboards
In the modern business landscape, data is abundant but actionable insights are scarce. Organizations gather massive amounts of information through Management Information Systems (MIS), yet the real challenge lies in translating this data into strategic decisions that propel the company forward. This is where Key Performance Indicator (KPI) dashboards come in — powerful tools that align MIS data with strategic goals, turning raw numbers into clear direction.
How effectively is your data transforming into direction through KPI dashboards?
KPI dashboards transform overwhelming data into clear, actionable insights—empowering organizations to align every move with their strategic vision
Understanding MIS and KPI Dashboards
Management Information Systems (MIS) are frameworks used to collect, process, and report data within organizations. They support operational control, management functions, and strategic planning by providing regular and structured information.
On the other hand, Key Performance Indicator (KPI) Dashboards are visual management tools that display critical performance metrics in an intuitive, real-time format. These dashboards provide a snapshot of how well the organization is performing relative to its objectives.
Why Align MIS with Strategic Goals Using KPI Dashboards?
The value of MIS data multiplies when it is aligned with an organization’s strategic priorities. KPI dashboards act as a bridge between data collection and strategic execution by:
- Offering real-time visibility: Leaders can monitor performance instantly and adjust strategies as needed.
- Enhancing focus: KPIs highlight the metrics that matter most, helping teams prioritize efforts.
- Driving accountability: Transparent dashboards encourage ownership and responsibility across departments.
- Enabling proactive management: Automated alerts and trend analyses help anticipate issues before they escalate.
Key Steps to Integrate MIS and Strategy with KPI Dashboards
- Identify Strategic Objectives:
Begin by clarifying the key goals your organization aims to achieve — whether it’s increasing market share, improving customer satisfaction, or boosting operational efficiency. - Select Meaningful KPIs:
Choose metrics that directly reflect progress toward these strategic objectives. Avoid vanity metrics that don’t drive real business outcomes. - Leverage MIS Data:
Ensure that your MIS is configured to capture the necessary data accurately and consistently to support the chosen KPIs. - Design the Dashboard:
Create dashboards that are user-friendly, visually engaging, and tailored to different audiences — executives, managers, or frontline teams. - Implement Monitoring and Feedback:
Use the dashboard to monitor ongoing performance and gather feedback to refine KPIs and improve data quality.
Common Challenges and How to Overcome Them
- Data Overload: Focus on a limited set of critical KPIs to avoid confusion and analysis paralysis.
- Data Quality Issues: Invest in data governance to maintain accuracy and reliability.
- Lack of Alignment: Regularly review KPIs to ensure they remain aligned with evolving strategic goals.
- Poor User Adoption: Train users on interpreting dashboards and encourage a data-driven culture.
Real-World Impact: A Case Example
Consider a manufacturing company aiming to reduce production downtime. By integrating MIS data on machine performance, maintenance schedules, and output quality into a KPI dashboard, the company can track uptime percentage, maintenance delays, and defect rates in real time. This visibility allows managers to pinpoint bottlenecks, schedule preventive maintenance proactively, and improve overall productivity — directly contributing to strategic cost reduction goals.
Conclusion
The journey from data to direction depends on effective integration between MIS and strategy through KPI dashboards. By translating complex data into actionable insights, these dashboards empower organizations to make informed decisions, stay agile, and achieve their strategic vision. In essence, KPI dashboards transform information overload into clarity and purpose, driving success from the top down.