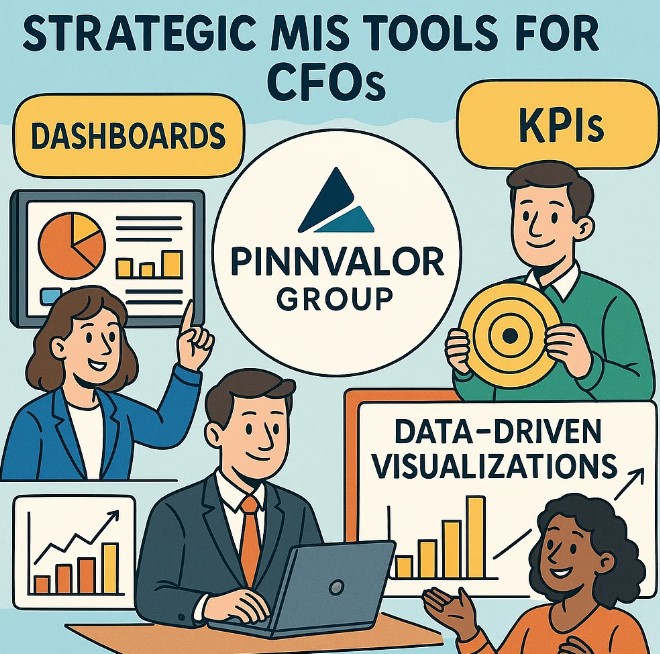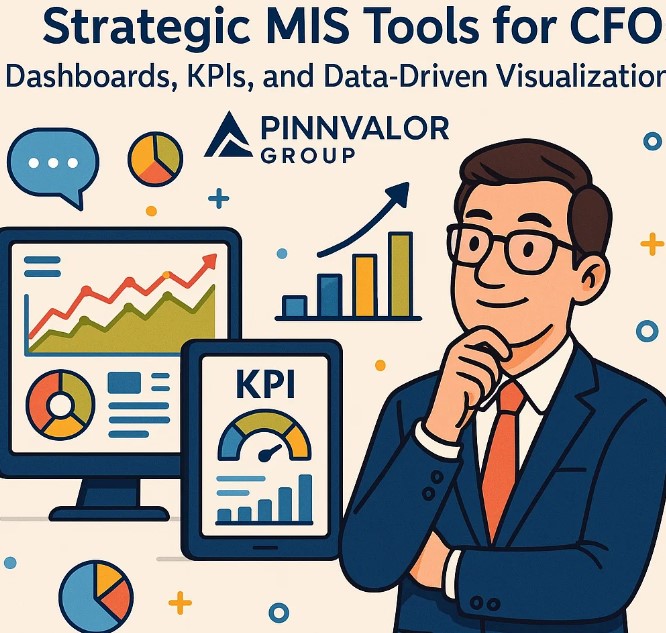
Strategic MIS Tools for CFOs: Dashboards, KPIs, and Data-Driven Visualizations
In today’s fast-paced business environment, Chief Financial Officers (CFOs) are tasked with not just managing the company’s finances but also driving strategic growth and operational excellence. To meet these challenges, CFOs increasingly rely on Management Information Systems (MIS) — sophisticated tools that turn raw data into actionable insights. This blog explores how strategic MIS tools, specifically dashboards, Key Performance Indicators (KPIs), and data-driven visualizations, empower CFOs to make informed decisions, improve financial performance, and lead with confidence.
Ready to discover how MIS tools can empower CFOs to make smarter, faster financial decisions?
In today’s data-rich world, CFOs who leverage strategic MIS tools become not just number crunchers but visionary leaders shaping their company’s future with confidence.
Understanding MIS and Its Role for CFOs
Management Information Systems (MIS) integrate data collection, processing, and reporting to provide timely and relevant information to management. For CFOs, MIS is critical because:
- It consolidates financial and operational data across departments.
- It offers real-time visibility into the company’s financial health.
- It enables proactive risk management and compliance monitoring.
- It supports strategic planning through data-driven insights.
By leveraging MIS, CFOs can transcend traditional finance roles and become strategic leaders shaping the company’s future.
The Power of Dashboards: Real-Time Financial Command Centers
Dashboards are at the heart of any effective MIS for CFOs. They provide a consolidated view of essential financial data on a single screen, enabling quick understanding and faster decision-making.
Key Benefits of Dashboards for CFOs:
- Real-Time Monitoring: CFOs can track cash flow, expenses, revenue, and profitability in real time.
- Customization: Dashboards can be tailored to highlight the most relevant metrics for specific business units or strategic goals.
- Drill-Down Capability: Users can dig deeper into summary data to identify trends, anomalies, or underlying issues.
- Collaboration: Shared dashboards foster alignment across finance, operations, and executive teams.
Common CFO Dashboard Components:
- Cash flow trends
- Budget vs. actual comparisons
- Accounts receivable/payable aging
- Expense breakdowns by category
- Financial ratios and forecasts
KPIs: Measuring What Matters Most
Key Performance Indicators (KPIs) translate business objectives into measurable targets. For CFOs, selecting and monitoring the right KPIs is vital to ensure financial and operational goals are on track.
Essential CFO KPIs Include:
- Revenue Growth Rate: Measures sales increases over time.
- Gross Profit Margin: Assesses profitability after direct costs.
- Operating Expense Ratio: Tracks efficiency by comparing operating expenses to revenue.
- Days Sales Outstanding (DSO): Indicates how quickly receivables are collected.
- Return on Equity (ROE): Shows the profitability relative to shareholders' equity.
- Debt to Equity Ratio: Monitors financial leverage and risk.
Why KPIs Matter:
- KPIs provide focus, enabling CFOs to prioritize resources and initiatives.
- They create accountability by setting clear targets.
- Continuous KPI monitoring allows early detection of financial issues.
Data-Driven Visualizations: Turning Numbers into Stories
Visualizations bring data to life, transforming complex numbers into intuitive charts, graphs, and infographics. For CFOs, these visual tools simplify communication with stakeholders who may not have deep financial expertise.
Popular Visualization Types for CFOs:
- Line and Bar Charts: Track financial trends and comparisons.
- Heat Maps: Identify performance hotspots or risk areas.
- Pie Charts: Display budget allocations or expense breakdowns.
- Waterfall Charts: Illustrate how different factors contribute to net income.
- Forecast Graphs: Visualize predicted financial outcomes based on scenarios.
Advantages of Visualizations:
- Accelerate comprehension of financial data.
- Enhance storytelling during board meetings and strategy sessions.
- Support scenario planning by visually modeling “what-if” analyses.

Integrating Dashboards, KPIs, and Visualizations for Maximum Impact
The true strength of MIS for CFOs lies in the integration of dashboards, KPIs, and visualizations into a unified system that supports continuous financial management and strategic agility.
- Dashboards serve as the control panel, presenting KPIs in an accessible format.
- KPIs focus attention on critical performance areas.
- Visualizations aid in interpreting KPI trends and communicating insights effectively.
Together, these tools enable CFOs to anticipate challenges, seize opportunities, and drive sustainable business growth.
Best Practices for CFOs Implementing Strategic MIS Tools
- Align MIS with Business Strategy: Ensure KPIs and dashboards reflect organizational goals.
- Focus on Data Quality: Reliable decision-making requires accurate and up-to-date data.
- Keep It Simple: Avoid dashboard overload; highlight the most meaningful metrics.
- Promote User Adoption: Train finance teams and executives to use MIS tools effectively.
- Leverage Automation: Automate data collection and reporting to save time and reduce errors.
- Continuously Review and Adapt: Regularly reassess KPIs and dashboard layouts to meet evolving needs.
Conclusion
In an era where data is a critical asset, CFOs must harness strategic MIS tools to stay ahead. Dashboards provide a real-time snapshot of financial health, KPIs focus attention on what matters most, and data-driven visualizations translate complex information into actionable insights. Together, they empower CFOs to lead with confidence, drive performance, and create lasting value for their organizations.
By embracing these MIS capabilities, CFOs not only enhance their financial stewardship but also elevate their role as strategic partners in business success.
Stay tuned for our upcoming posts on hedge accounting under IFRS 9 and a comparative analysis of IFRS 9 vs. Ind AS 109.
