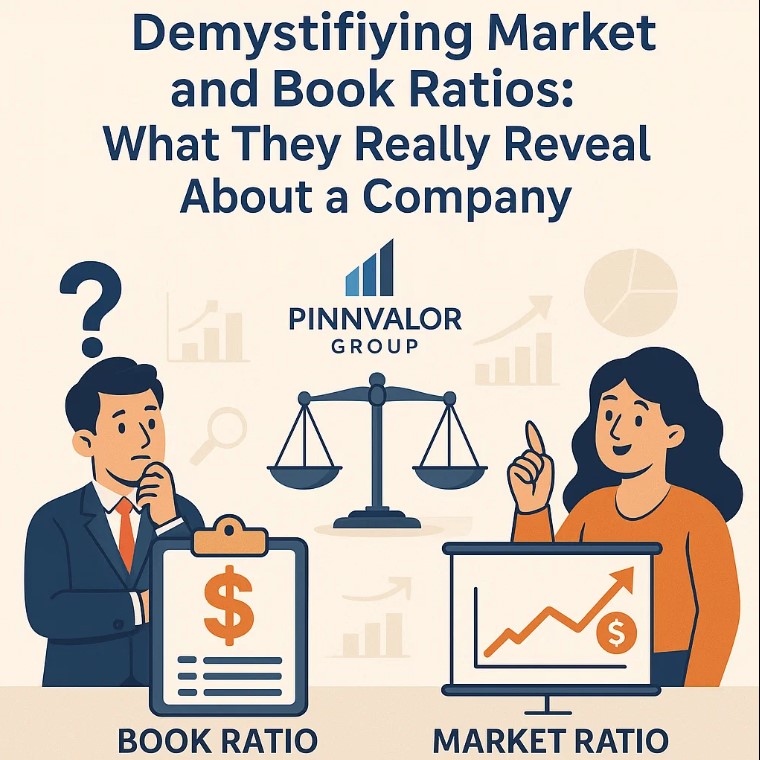
Demystifying Market and Book Ratios: What They Really Reveal About a Company
In the world of financial analysis and corporate valuation, numbers speak louder than words — but which numbers are we really listening to? This is where the distinction between market ratios and book ratios becomes crucial.
While both types of ratios offer insights into a company’s performance and value, they stem from very different sources and reflect contrasting perspectives — one grounded in accounting data, the other in market perception.
Let’s dive deep into what these ratios are, how they differ, and what they can truly tell us about a company’s financial health and valuation.
Are you evaluating a company based on facts from the past — or expectations of the future?
Behind every financial ratio lies a story — one told by balance sheets, and the other by the market. Understanding both is the key to smarter valuation.
Understanding Book Ratios: Based on Historical Cost and Accounting Data
Book ratios are derived from financial statements — primarily the balance sheet and income statement — and reflect the company’s performance and position based on historical accounting entries.
Common Book Ratios:
- Return on Assets (ROA): Net income ÷ Total assets
- Debt-to-Equity Ratio (D/E): Total liabilities ÷ Shareholder’s equity
- Return on Equity (ROE): Net income ÷ Book value of equity
- Current Ratio: Current assets ÷ Current liabilities
Pros:
- Based on verifiable, standardized data
- Useful for internal performance comparison
- Ideal for regulatory and credit assessments
Cons:
- May not reflect the true economic value of assets
- Often miss out on intangible value (e.g., brand, goodwill, tech)
- Historical cost principle can distort asset valuations over time
Decoding Market Ratios: Reflecting Investor Sentiment and Expectations
Market ratios are calculated using the company's stock price and reflect what the market thinks the company is worth today — based on future expectations, industry dynamics, and investor perception.
Common Market Ratios:
- Price-to-Earnings Ratio (P/E): Market price per share ÷ Earnings per share
- Price-to-Book Ratio (P/B): Market price per share ÷ Book value per share
- EV/EBITDA: Enterprise Value ÷ EBITDA
- Dividend Yield: Dividend per share ÷ Market price per share
Pros:
- Reflect real-time investor expectations
- Capture intangible value and future growth prospects
- Used heavily in stock valuation and peer comparisons
Cons:
- Highly sensitive to market fluctuations
- Can be influenced by speculation and noise
- Less useful during times of irrational market behavior

Market vs Book: A Tale of Two Perspectives
| Aspect | Book Ratios | Market Ratios |
|---|---|---|
| Source | Accounting records | Market data (stock prices) |
| View | Historical | Forward-looking |
| Objective | Operational and financial health | Market valuation and investor sentiment |
| Strength | Accuracy and standardization | Real-time relevance |
| Limitation | May understate value | May overstate or misjudge fundamentals |
Why the Difference Matters
Understanding both ratio types helps you:
- Bridge the gap between operational performance and market valuation
- Identify undervalued or overvalued stocks
- Evaluate management performance in driving tangible and intangible value
- Support investment and lending decisions with a balanced view
Key Takeaway
Book ratios reveal the foundation. Market ratios forecast the future.
Together, they form a 360-degree view of a company’s worth.
Conclusion
While book ratios anchor you in reality, market ratios push your gaze forward. Financial clarity comes not from favoring one over the other but from interpreting them in tandem. Investors, analysts, and managers who understand how to navigate both metrics gain the upper hand in making strategic, data-backed decisions.
